 Home
Home
|
Table of Content - Volume 19 Issue 1 - July 2021
Demographic profile of drowning deaths autopsied in Chennai
Manigandaraj G1, Selvakumar R2
1Senior Assistant Professor, 2Professor and HOD, Department of Forensic Medicine and Toxicology, Government Kilpauk Medical College and Hospital, Chennai – 10, INDIA. Email: manigandaraj@yahoo.com
Abstract Background: Drowning is considered to be the third leading cause of unintentional injury death and is a major, but often neglected, public health problem. According to World Health Organisation, drowning is among the ten leading causes of death for children and young people in every region of the world. Drowning amounts to an estimated incidence of about 5.6 per 100,000 populations worldwide. Aim: To know the incidence, manner and epidemiology of deaths due to drowning in and around Chennai. Material and Methods: The study period was for (1) Year from 01-01-2020 to 31-12-2020. Results: In the study period 2719 cases of Post – Mortem Examination was done among it 61 cases (2.24%) were found to be drowning related deaths. The analysis of the study is as follows. Drowning related deaths were found to be high in males (90.16%). Maximum cases of drowning were seen in the age group of 21-30 Years (62.29%). Maximum cases of drowning related deaths were seen in the month of October which constitutes (22.95%). Maximum cases of death happened during evening time (04.01 P.M to 8.00 P.M) which constitutes (63.93%). Maximum cases of death were seen in unemployed persons (45.90%). Maximum cases of death were seen in unmarried people who constitute (55.73%). Maximum cases of death were seen in middle socio economic class (63.93%). Maximum cases of death were seen in Hindu Religion (80.32%). Maximum cases of death occurred in the canal (45.90%). Maximum cases of death were suicidal (62.29%). Key Words: Drowning Deaths, Well, Sea Water Drowning, Fresh Water Drowning.
INTRODUCTION The well – known saying that “Water is life” itself reveals the fact that, there will be no existence of life without water. Millions of years ago, the first appearance of life on earth had occurred in water.3 In addition to its life sustaining role, water is one of the most destructive forces on earth in the form of tsunamis and flood disasters, which are responsible for the loss of life on a large scale3. On the other hand, famine had claimed millions of lives in the world many times. So it could be said that water is a “Double Edged Sword”3. World Health Organization (WHO) had adopted the new definition at the first world congress in 2002 as “Drowning is the process of experiencing respiratory impairment from submersion or immersion in liquid. World Health Organization described drowning is one of the top five causes of death in children aged between 1- 14 Years and one of the ten leading cause of death in children and young people aged between 1 and 24 Years.3 All unattended drowning cases should be presumed homicide until proven otherwise. Drowning and alcohol intoxication may represent accidents or suicides. In suicidal attempts by drowning, the suicidal attempter often leaves behind a letter or a phone call before departing to jump into the water. Homicidal drowning is uncommon and requires either physical disparity between the assailant and the victim or a victim incapacitated by disease, drink or drugs or taken by surprise. Disposal in water may be attempted where the victim has already been killed by other means.5 Population – based data are appropriate in identifying and prioritizing the burden of drowning, but are not usually available. Drowning is under reported in hospital – based data. It is very difficult to find distinctions between unintentional and intentional drowning death. Educating people about risks, resuscitation training and near supervision are important steps which could be applied for better outcome1. More research is needed to study the circumstances under which drowning seems to occur, the first aid procedures and fast health care response, not only within country but also cross nationally. Also, data on good practice which is obtained from other countries need to be transferred to other low and middle income. There is an urgent need to get drowning related loss higher on the agenda for policy makers and researchers, whatever the intervention we need to apply. Also media can play a vital role for educating the people for water safety1. AIM OF THE STUDY To study and analyze the incidence, epidemiology, manner and circumstances of drowning deaths reported in and around Chennai.
MATERIALS AND METHODS In this study, all the autopsies done on person died due drowning in the year 2020 from 01-01-2020 to 31-12-2020 were studied based on the requisition of conduct of autopsy and inquest report. A proforma was prepared such as sex, age, month, time of occurrence, occupation, education, religion, marital status, source of drowning, cause of death and manner of death. It was then interpreted statiscally with tables and bar diagrams. INCLUSION CRITERIA All cases of drowning deaths that have come with requisition for Post – Mortem Examination to Government Kilpauk Medical College and Hospital, Chennai -1 0 from 01-01-2020 to 31-12-2020. EXCLUSION CRITERIA Decomposed and skeletonised dead bodies were excluded out from our study.
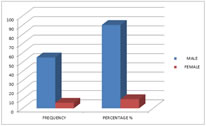
OBSERVATIONS TABLE 1: SEX WISE DISTRIBUTION OF DROWNING DEATHS
Drowning related deaths were found to be high in males (90.16%).
Figure 1
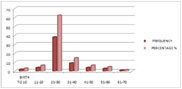
TABLE 2: AGE WISE DISTRIBUTION OF DROWNING DEATHS
Maximum cases of drowning were seen in the age group of 21-30 Years (62.29%) followed by 31-40 Years (14.75%).
Figure 2
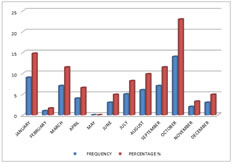
TABLE 3: MONTH WISE DISTRIBUTION OF DROWNING DEATHS
Maximum cases of drowning related deaths were seen in the month of October which constitutes (22.95%) followed by January month (14.75%).
Figure 3
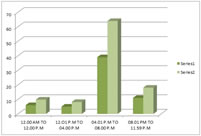
TABLE 4: TIME OF OCCURRENCE
Maximum cases of death happened during evening time (04.01 P.M to 8.00 P.M) which constitutes (63.93%) followed by night time (08.01 P.M to 11.59 P.M) which constitutes (18.03%).
Figure 4
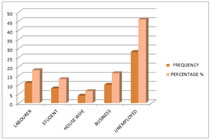
TABLE 5: OCCUPATION
Maximum cases of death were seen in unemployed persons (45.90%) followed by labourer which constitutes (18.03%).
Figure 5
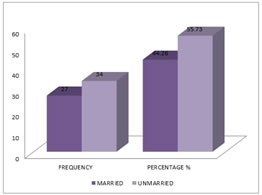
TABLE 6: MARITAL STATUS
Maximum cases of death were seen in unmarried people who constitute (55.73%).
Figure 6
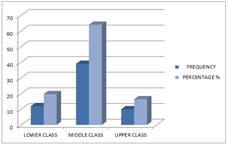
TABLE 7: SOCIO ECONOMIC STATUS
Maximum cases of death were seen in middle socio economic class (63.93%) followed by lower socio economic class (19.67%).
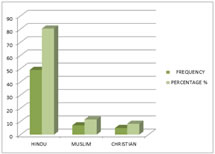
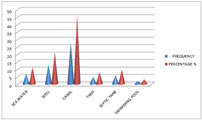
Figure 7 TABLE 8: RELIGION WISE DISTRIBUTION OF DROWNING DEATHS
Maximum cases of death were seen in Hindu Religion (80.32%) followed by Muslim Religion (11.47%).
Figure 8
TABLE 9: SOURCE / MEDIUM OF IMMERSION
Maximum cases of death occurred in the canal (45.90%) followed by drowning inside the well (21.31%). Figure 9
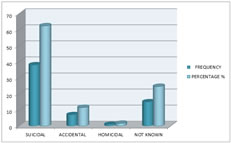
TABLE 10: MANNER OF DEATH
Maximum cases of death were suicidal (62.29%) followed by manner of death not known which constitutes (24.59%).
Figure 10
DISCUSSION Drowning related deaths were found to be high in males (90.16%). This is similar to the study conducted by Auer, Quan, Suresh Kumar Shetty, Pathak and Mangal and Saberi Anary et al. 6,7,8,9,10 Reason behind male predominance of cases, probably is multifactorial, especially men have more opportunities to drown in that they have greater probability of high exposure activities where submersion is possible. Maximum cases of drowning were seen in the age group of 21-30 Years (62.29%) followed by 31-40 Years (14.75%). This is similar to the study conducted by Auer, Quan, Suresh Kumar Shetty, Pathak and Mangal and Saberi Anary et al.6,7,8,9,10. The probable reason behind preponderance of 21-30 years age group in drowning is carelessness and adventurous nature usually seen in youngsters while swimming or doing recreational activities in or around water source leading to accidental deaths. This is followed by the age group of 31-40 years, it may be due to familial and financial problems arising in life and their inability to deal with them. Maximum cases of drowning related deaths were seen in the month of October which constitutes (22.95%) followed by January month (14.75%). This is almost similar to the study conducted by phad and dhawane2. The summer and monsoon seasons have maximum number of deaths. This phenomenon is denoted by the holiday season in summer, when a large number indulge in adventurous exploits and monsoon draws one towards adventure and is as well occupation related. Maximum cases of death happened during evening time (04.01 P.M to 8.00 P.M) which constitutes (63.93%) followed by night time (08.01 P.M to 11.59 P.M) which constitutes (18.03%). This is almost similar to the study conducted by Niraj Kumar, Vivek Mangare, Naman Kandpal, Aishwarya Bajpei1. This could be explained to the occupation in which they were engaged and could be attributed to the shift / timing of work and also evening time could be considered as pleasant time for swimming. Maximum cases of death were seen in unemployed persons (45.90%) followed by labourer which constitutes (18.03%). This is in contrast to the study conducted by Laxman Gangadhar Phad and Shailendra G. Dhawane3 where most common victims of drowning deaths were the students but in our study unemployed persons had higher preponderance. This could be attributed to financial and familial problems faced by the unemployed persons. Maximum cases of death were seen in unmarried people who constitute (55.73%). This study is in contrast to the studies conducted by Gorea and Singh12, Ranga Rao et al. and Laxman Gangadhar Phad and Shailendra G.Dhawane3,8 were married people were in maximum who drowned and died. This could be explained to the attitude and amount of stress / responsibilities and depression in unmarried individuals to get into a good job and settle down with family later. Maximum cases of death were seen in middle socio economic class (63.93%) followed by lower socio economic class (19.67%). This is almost similar to the studies conducted by Dietz and Baker, Auer, Fralict et al. and Laxman Gangadhar Phad and Shailendra G.Dhawane3,8,14. This could be attributed to familial and financial problems which middle socio economic class people face. Maximum cases of death were seen in Hindu Religion (80.32%) followed by Muslim Religion (11.47%). This is almost similar to the studies conducted by Pathak, Mangal and Laxman Gangadhar Phad and Shailendra G.Dhawane.3,7 This can be attributed tothe predominance of the Hindu population where the study was carried out. Maximum cases of death occurred in the canal (45.90%) followed by drowning inside the well (21.31%). This in contrast to the study conducted by Raja Sekhar Uppu, BVS Ananda Rao, Beemsetty Rajesh2 where maximum drowning related deaths were seen in sea water. This could be attributed to easy accessibility of canals and wells in that particular locality rather than beach. Maximum cases of death were suicidal (62.29%) followed by manner of death not known which constitutes (24.59%). This is in contrast to the study conducted by Raja Sekhar Uppu, BVS Ananda Rao, Beemsetty Rajesh2 where accidental deaths due to drowning is high. This could be attributed to the mental makeup of the individual at that particular time and accessibility could be another reason. However in our study around 24.59% manner of death was not known as there were was adequate history or reason / risk factors pertained to drowning related death. One case of homicide was reported in our study where the mother itself killed the child by throwing him inside the well due to child being born of illegitimate relationship.
CONCLUSION From this study it is very clearly evident that drowning amounts to significant number of deaths in young males in the age group of 21 – 30 Years. Most of them died by committing suicide which denotes the lack of safety measures in the canals / water bodies. This can be rectified if people are employed in the canals / surrounding water bodies with watchers and also improve safety by committing rescue teams after identifying the places with high activity and save those victims.
RECOMMENDATIONS Based on our study result we suggest that there may be a need for drowning prevention strategies that are tailored to specific need of this geographical region. The government should draft specific policy, plans and provide budget and implement strategy for drowning prevention.
REFERENCES
Policy for Articles with Open Access
|
|
 This work is licensed under a Creative Commons Attribution-NonCommercial 4.0 International License.